
Log Management
View, filter, and manage daemon logs. Pitchfork stores all daemon logs in a SQLite database (~/.local/state/pitchfork/logs/logs.db) with full timestamp indexing, making filtering by time fast and reliable.
View Logs
View logs for a daemon:
pitchfork logs apiIn interactive terminals, logs automatically use a pager (like less) when output exceeds the terminal height. The pager starts at the end of the logs for easy viewing of recent entries.
Tail Logs
Follow logs in real-time:
pitchfork logs api --tail
# or use --follow, -t, -f
Press Ctrl+C to stop following.
Multiple Daemons
View logs from multiple daemons at once:
pitchfork logs api worker databaseLogs are interleaved with timestamps to show the correct order.
Search message text
pitchfork logs api --grep timeout
pitchfork logs api --grep timeout --grep refused
pitchfork logs api --regex 'HTTP [45][0-9]{2}'
--grep is case-insensitive unless you add --case-sensitive. Repeated --grep values match with OR. Use --regex for a regular expression.
Filter by Line Count
Limit the number of lines shown:
# Last 50 lines
pitchfork logs api -n 50

# Last 10 lines
pitchfork logs api -n 10
When combined with time filters, -n limits the output from the filtered results.
Filter by Time
Show logs from a specific time range using --since (or -s) and --until (or -u):
Relative Time
# Logs from last 5 minutes
pitchfork logs api --since 5min

# Logs from last 2 hours
pitchfork logs api --since 2h

# Logs from last day
pitchfork logs api --since 1d
Time Only (Today's Date)
# Logs since 10:30 AM today
pitchfork logs api --since 10:30

# Logs since 14:30:00 today
pitchfork logs api --since 14:30:00
Full Datetime
# Logs since a specific datetime
pitchfork logs api --since "2024-01-15 09:00:00"

# Logs until a specific datetime
pitchfork logs api --until "2024-01-15 17:00:00"

# Logs within a time range
pitchfork logs api --since "2024-01-15 09:00" --until "2024-01-15 12:00"
Combining with Line Limit
# Last 20 lines from the past hour
pitchfork logs api --since 1h -n 20
Structured Log Parsing
Pitchfork can parse structured logs when configured produced by your daemons. When a log line is written in JSON or logfmt format, pitchfork extracts fields such as level, msg, and logger and stores them alongside the original message. This makes it possible to filter by log level, query individual fields, and pipe output through jq expressions.
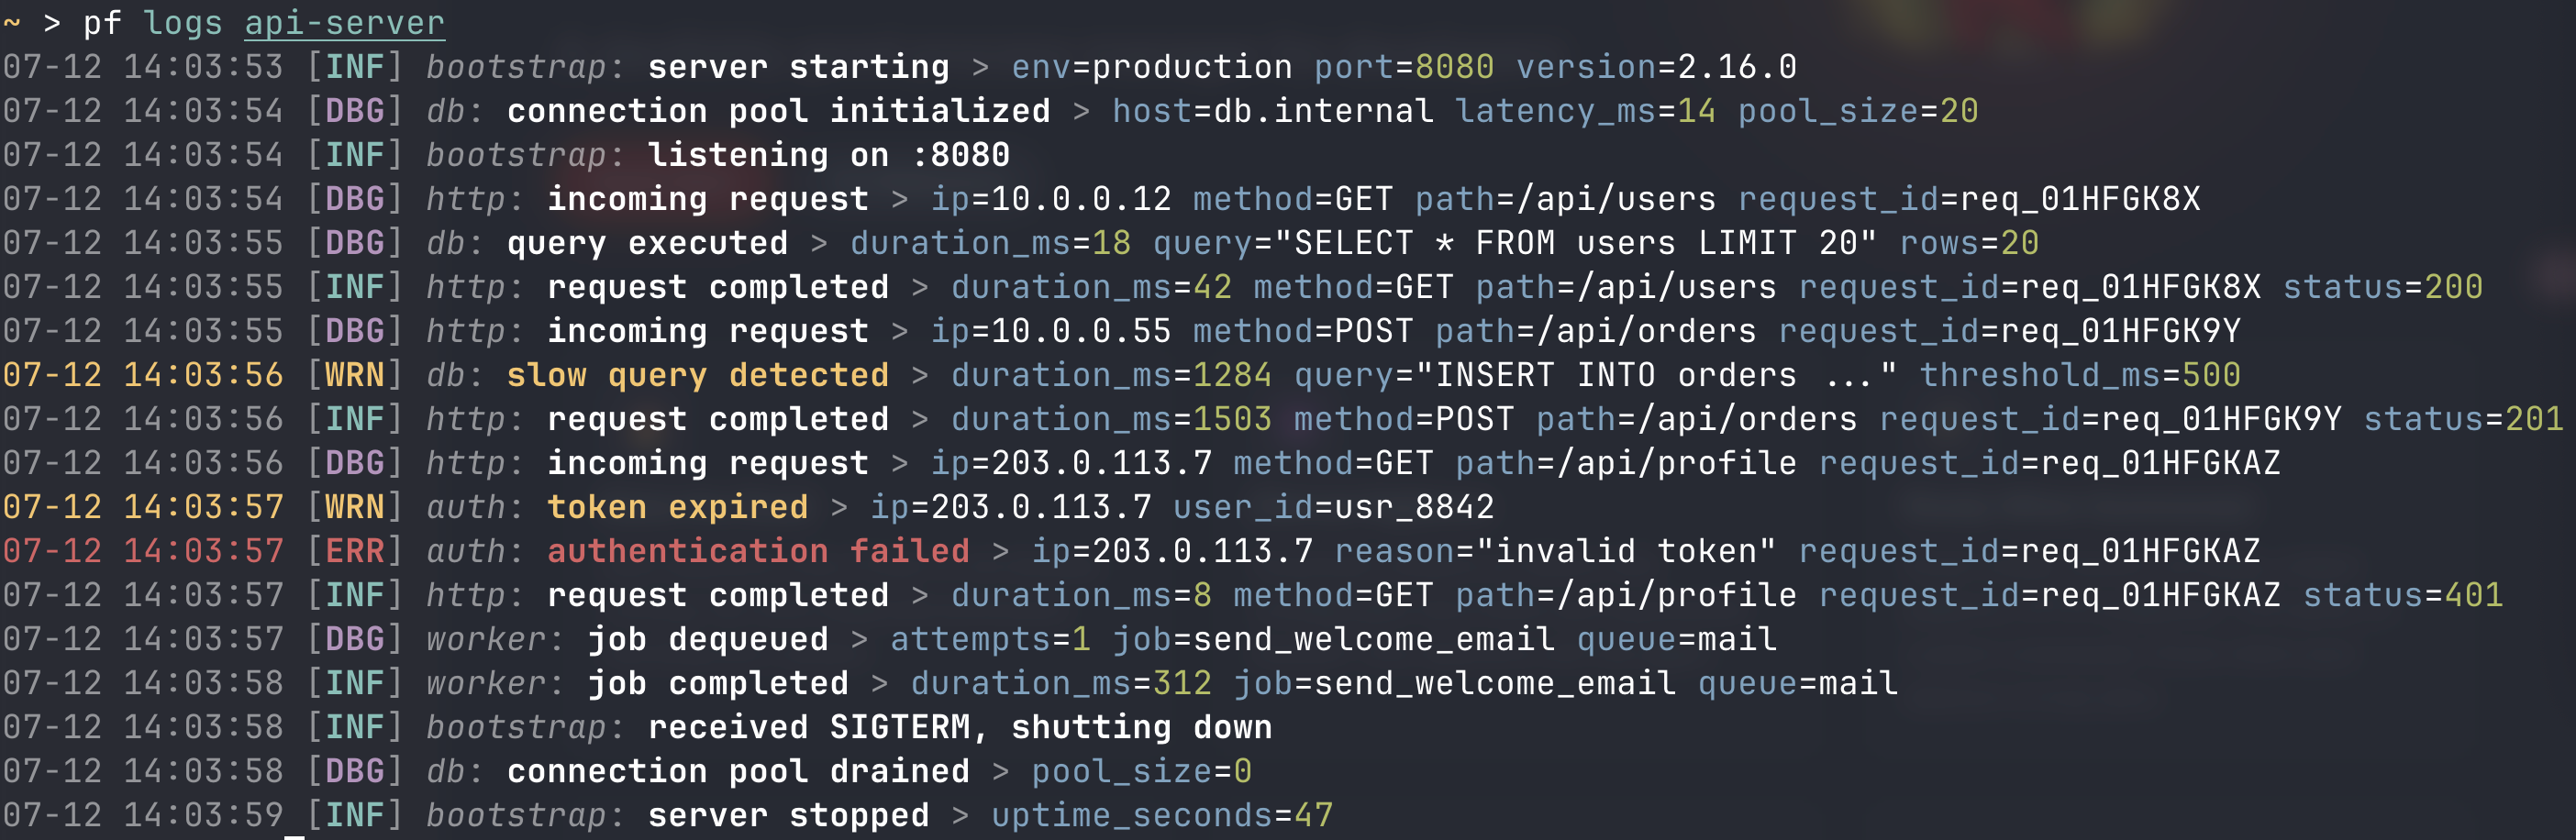
Configure Log Format
Log parsing can be configured per daemon or applied globally as a default.
Per-daemon configuration:
[daemons.api]
run = "node server.js"

[daemons.api.logs]
log_format = "json"  # json | logfmt | text
Global default in [settings.logs]:
[settings.logs]
log_format = "json" # json | logfmt | text (default: text)| Format | Description |
|---|---|
json | Parse as single-line JSON (NDJSON) |
logfmt | Parse as key=value space-delimited pairs |
text | No parsing, store as plain text (default) |
Filter by Level
pitchfork logs api --level error
pitchfork logs api --level warn
--level warn includes both warnings and errors; the flag selects a minimum severity. Level values are normalized automatically. For example, fatal, critical, panic, and err all match error, while warning matches warn.
Filter by Field
pitchfork logs api --field request_id=abc123
pitchfork logs api --field status=500 --field method=GET
Multiple --field flags must all match. Field names refer to the structured data in the original log line.
jq Filtering
pitchfork logs api --jq '.level == "error" and .fields.status >= 500'
pitchfork logs api --jq '.fields.request_id | startswith("req_00")'
Each log entry is serialized into a JSON object with timestamp, daemon_id, message, level, msg, logger, and fields. The jq expression is evaluated against each object; entries that return a truthy value are kept.
Pitchfork ships with jaq, a pure-Rust jq implementation, so no external jq binary is required.
JSON Output
pitchfork logs api --jsonThis outputs a JSON array with structured fields:
[
  {
    "timestamp": "2025-07-08 12:00:00",
    "daemon_id": "global/api",
    "message": "{\"level\":\"info\",\"msg\":\"started\"}",
    "level": "info",
    "msg": "started",
    "logger": "main",
    "fields": { "port": 8080 }
  }
]
The level, msg, logger, and fields fields are only present when the log line was successfully parsed.
Composing Filters
--level, --field, --grep, and --regex are applied at the SQL layer to narrow the candidate set first. --jq then filters the remaining entries in the application layer:
# SQL layer filters level=error, then jq filters status>=500
pitchfork logs api --level error --jq '.fields.status >= 500'

# --grep and --field can be combined
pitchfork logs api --grep "timeout" --field service=api
Raw Output
Output raw log lines without color or formatting:
pitchfork logs api --rawUseful for:
- Piping to other tools:
pitchfork logs api --raw | grep ERROR - Saving to files:
pitchfork logs api --raw > api.log - Processing with scripts
Disable Pager
Disable the automatic pager in interactive terminals:
pitchfork logs api --no-pagerThis forces direct output to stdout, even when output would normally trigger the pager.
Clear Logs
Delete all logs for a daemon:
pitchfork logs api --clearLog Rotation
Pitchfork supports automatic log rotation via time_retention and line_retention settings. Old entries are pruned periodically by the supervisor so the database does not grow unbounded.
Automatic Rotation
Configure in any pitchfork.toml under [settings.logs]:
[settings.logs]
# Keep only the last 7 days of logs
time_retention = "7d"

# Or keep only the most recent 10,000 entries
line_retention = 10000

# You can also combine both (entries older than 7d OR exceeding 10,000 lines are pruned)
# time_retention = "7d"
# line_retention = 10000
Supported formats:
- Time-based (
time_retention):"7d","30d","1h"— delete entries older than this duration - Count-based (
line_retention):10000,5000— keep only the most recent N entries per daemon - Unset (default): no automatic pruning
The supervisor evaluates retention during its interval watcher cycle, no more than once per hour.
Migrate Legacy Logs
If you were using pitchfork before the SQLite log store was introduced, legacy text log files may still exist under the logs directory. They are automatically imported into the SQLite database on the first access to the log store, so no manual action is required.
Supervisor Logs
View pitchfork's own logs:
pitchfork logs pitchforkTUI and Web UI
You can also view logs in real-time through the TUI (pitchfork tui) or Web UI (if enabled).
Log Storage Location
Logs are stored in a single SQLite database at ~/.local/state/pitchfork/logs/logs.db. Entries are keyed by the daemon's qualified ID (namespace/name). See File Locations for details on the state directory resolution.
Archive before pruning
Send entries to an archive command before retention deletes them:
[settings.logs.archive_hook]
command = "gzip -c >> /path/to/archive.jsonl.gz"
batch_size = 1000
The command receives JSON Lines on stdin. If it fails, pruning is skipped for that batch. Create the destination directory and make sure the supervisor can write to it. See the archive settings.
For one daemon, use [daemons.api.logs] with time_retention, line_retention, and archive_hook fields. These override global defaults.